Workaround for Azure SDK Invalid access to memory location error
There is an issue with the Azure 1.6 SDK that I often hit when I run a cloud project. I get around 3-5 debug sessions with my cloud project before Visual Studio starts throwing an Invalid access to memory location error.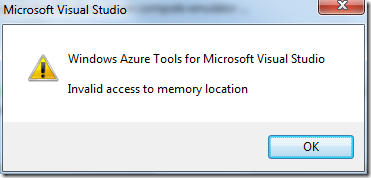
This issue seems like it is hitting many other people as well. This is a significant pain point for working with Azure projects and there is currently no suitable workaround or fix that I can find. Sometimes shutting down the emulator and trying again works. Most often however, the IDE needs to be recycled. Having to do this each fifth F5 is a productivity killer.
It seems that the most reliable information out there is that the issue is caused by addins/extensions in Visual Studio. This is consistent with my experience of running automated integration tests as defined in my previous posts. I quickly encounter this problem running F5 from the IDE, yet launching Azure and IISExpress for integration tests does not suffer from this error. This leads me to a reliable workaround for this issue based on my integration test implementation using the External Tools support in Visual Studio to manually launch the emulator.
Configuring External Tools
We need to add three External Tools entries. These are for launching the compute emulator in the Debug configuration, another one for the Release configuration and finally the storage emulator.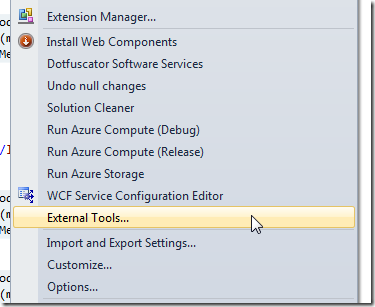
Click Tools –> External Tools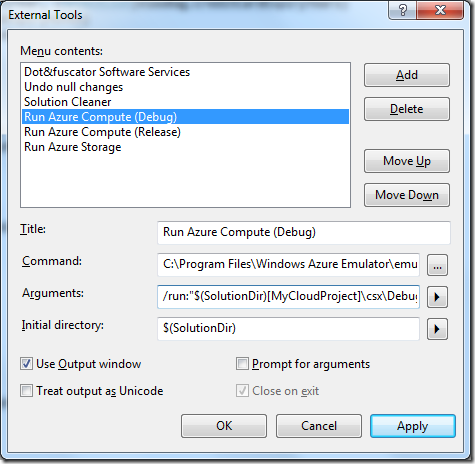
First up is to configure launching the emulator for the debug configuration.
- Click Add
- Enter the title for running the compute under debug
- Enter the command as C:\Program Files\Windows Azure Emulator\emulator\csrun.exe
- Enter the arguments as /run:"$(SolutionDir)[YourCloudProjectName]\csx\Debug";"$(SolutionDir)[YourCloudProjectName]\bin\Debug\ServiceConfiguration.cscfg" /launchBrowser
- Setting the Initial directory is optional, but $(SolutionDir) is as good as any setting
- Check Use Output Window and click Apply
Unfortunately the ExternalTools window does not process the $(ConfigurationName) macro like the build events function does. This is why we need an entry for each build configuration (typically Debug and Release).
Create a new External Tools entry for the compute emulator to load the Release build. It will have the same configuration except that references to Debug are replaced with Release.
Create a new External Tools entry for the storage emulator. The arguments for this field are /devstore:start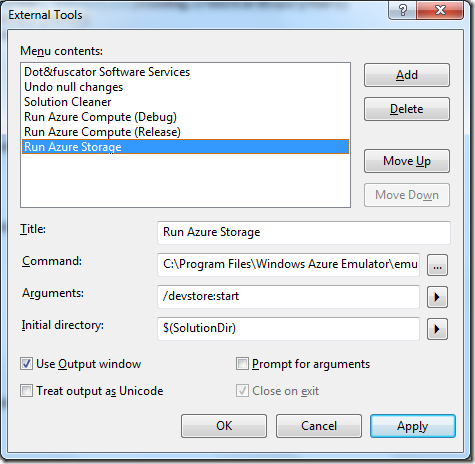
The requirement for a separate entry for the storage emulator is unfortunate. It is required because the csrun.exe does not support command line parameters for both the compute emulator and the storage emulator in the one execution.
Attaching the debugger
You can configure csrun to attach to the debugger using the /launchDebugger switch. I did not want to use this switch because it will open new instances of the debugger (typically devenv.exe) for each role instance (web and worker). This is unhelpful because I want to use the existing Visual Studio instance. I also found that the browser could not hit the compute instance anyway when the debugger was attached in this way (this could be just a timing issue though).
The easiest way around this is to just attach to the process manually.
Click Debug –> Attach to Process…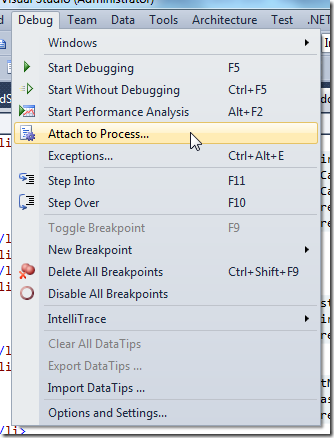
Find w3wp.exe and click Attach.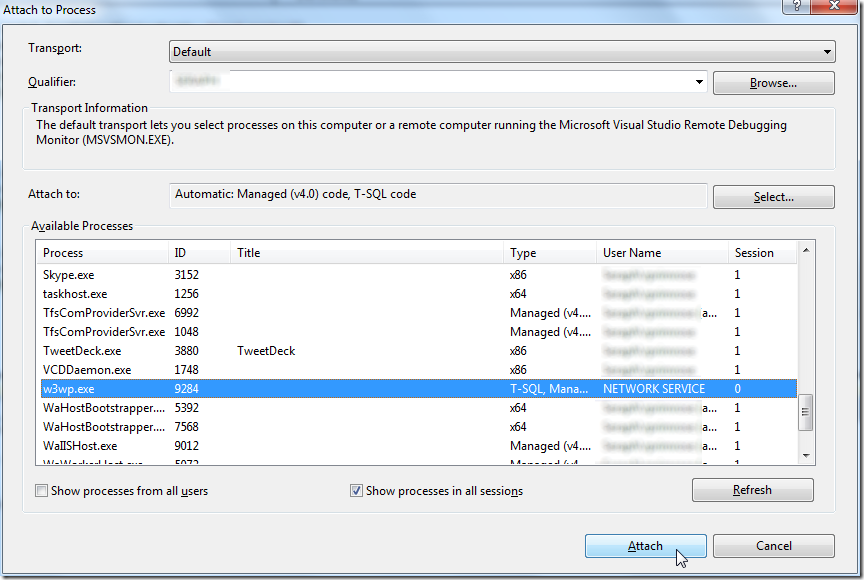
Notes
This workaround only spins up the compute emulator or the storage emulator. It does not do any of the following:
- Build/Rebuild your projects
- Request shutdowns of the emulators
- Attach a debugger