The evils of System.Diagnostics.Trace
There are a few occasions when I have used System.Diagnostics.Trace rather than a System.Diagnostics.TraceSource implementation. Those occasions are limited to scenarios where the consumers of the components didn’t write them, have little interest in their inner workings and don’t need to troubleshoot them. Framework/toolkit type components are the most common implementations that face this.
For example, I have recently done some work on custom tracing implementations that make it really easy for developers to add activity tracing and activity correlation to their code. I wanted to output some messages for diagnostic purposes if there were unexpected issues encountered in the tracing component. Tracing is the right tool for the job, however given that the component is all about tracing, what implementation do I use to trace the information required?
Back to the basic .Net framework is really the only option which means using System.Diagnostics.Trace in this case. This simple reason for this is that in a framework type component, what TraceSource in an application configuration would I use? I’m also not a fan of hard-coded configuration keys if they can be avoided, so Trace seemed like a better option than TraceSource.
In this component, I was tracing three messages regarding an operation that resolves TraceSource implementations. One message indicated a TraceSource name the component was searching for, the second was a warning message if a TraceSource wasn’t found and the third was tracing the result of the resolution. This code is a performance critical code path because it has an incredibly high call rate. If this component isn’t running as fast as possible, whole systems will slow down.
I found this to be the case as I was running load tests against code that used these components.
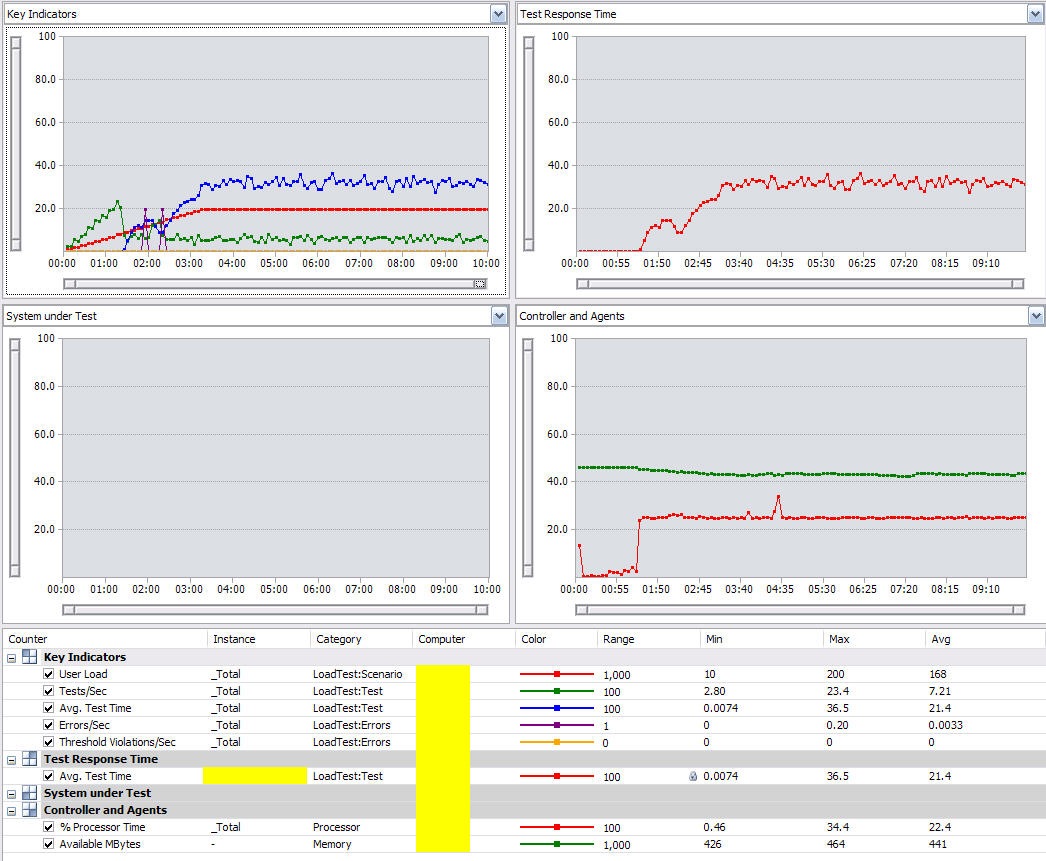
This is the load test with those three trace messages in the code. This is a particular nasty one. The degrading performance of the test rate (blue line in top left or red line in top right) is not reflective of the increase in user load (red line in the top left). The spike in the CPU also has an interesting behaviour. There is a point where a bottleneck is reached because of the load and the CPU just can’t keep up. The average test time starts peeking out around 36 seconds a test. Without a doubt, this is unacceptable.
If the three trace statements are removed, the difference is dramatic.
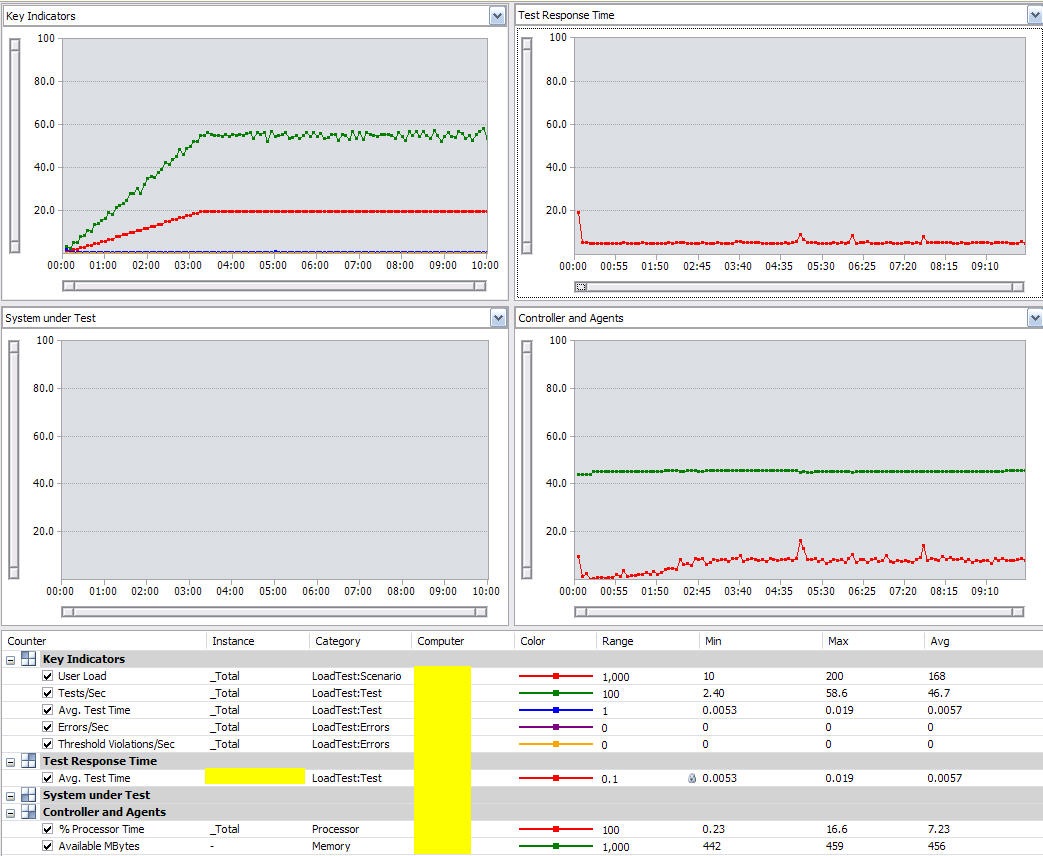
The different scales used in the between the two graphs really don’t do this difference the justice it deserves. Without the three Trace statements, the tests sit at a comfortable average of 5.7 milliseconds per test with a maximum of 19 milliseconds. The increase in tests/sec also doesn’t do this change justice. The maximum tests/sec went from 23 to 58. This isn’t however because of a performance bottleneck but quite the opposite. As the performance is now so much better, 58 tests/sec was the maximum number of tests required to execute the test rate defined for 200 users in the load test. This load test could now be cranked up with more tests/user/hr and more users in order to find out what the performance of the code is when running at capacity.
This is a good example of why you should always avoid the Trace class in favour of TraceSource. The Trace class simply writes out to the configured set of TraceListener implementations. There is no SourceSwitch used to indicate whether it should be tracing the type of event being written. It’s implementation also uses a set of foreach statements that are much slower than for statements which, without a preventing SourceSwitch, just slows the code down further.
The TraceSource class is a different beast. Each TraceSource can be configured with a SourceSwitch that defines which trace event types will be written to the configured set of TraceListener implementations. TraceSource is also kinder to your performance because it uses a for statement rather than foreach. This means that even if the SourceSwitch defined will allow the event to be written, it will run through the TraceListeners just that little bit quicker. Such an insignificant improvement in the loop doesn’t sound important, but when the application is invoking that loop operation potentially millions of times, it is really critical.